Coronavirus Look Ahead
What are we in for?
Bad strategy fails to recognize or define the challenge. When you cannot define the challenge, you cannot evaluate a strategy or improve it.
—Richard Rumelt, Good Strategy, Bad Strategy
There’s been a torrent of discussion about COVID-19 on Twitter, and pretty much everywhere else, this week. I don’t have anything truly new to add, but per the Rumelt quote above, I want to spell out the situation as clearly as I can. I don’t think we can fully know the future, but we can begin by trying to get a good understanding of the present. We can base our decision making—business and personal—around those facts.
Disclaimers: I’m not an epidemiologist, so I hesitate to put hard numbers out there. I won’t use the word forecast, because this is a guess based on publicly available data and possibly faulty reasoning. I will show my work in the hopes that my faults can be corrected. With apologies to international readers, this post will focus on the USA.
Nearly all media reports most prominently cite counts of confirmed cases. However, this number is almost meaningless right now for two reasons. First, lack of test availability means only people with known exposures or symptoms are tested. Second, symptoms for this disease often don’t appear for a week or two after infection and transmission occur. Those two factors combined mean that there are many undetected cases.
While official case counts are clearly not reliable, reports of COVID-19 deaths are much more likely to be reliable. Unlike reported cases, COVID-19 deaths are simpler to observe and confirm.
The problem with counting deaths is that they’re a lagging indicator. Per this page, it takes about 5 days from exposure to onset of symptoms, and it’s another 17 days, on average, until death occurs. So let’s assume that deaths lag cases by roughly 23 days. (Rough, because cases that wind up fatal may show symptoms more quickly).
Given that, here are the important variables:
The USA currently is reporting 59 deaths (as of 3/15/20)
Disease incidence has roughly doubled every 6 days in other countries. Since deaths lag cases by 23 days, we can assume there have been 23/6 = 3.83 doublings. (Spread might slow down given social distancing measures).
Case fatality rate is ~1% (assuming there is enough system capacity to treat critical cases; without sufficient capacity, CFR goes up. But so far there has been capacity.)
Putting it all together:
59 deaths / 1% CFR = 5,900 cases, as of 23 days ago.
3.83 chances to double over 23 days. 5,900 cases * (2^3.83) = ~84,000 estimated cases as of today, March 15th.
Please assume a VERY wide confidence interval here as we’re applying exponents to uncertain numbers.
My estimate is hopefully an overstatement, given the effects of clustering: most deaths so far have been in just two counties near Seattle, and that city’s social distancing measures went in effect there more quickly than elsewhere.
Here’s a twitter thread by a much more informed person than I, who arrives at an estimate of 20k cases under a different methodology (and also a couple of days ago).


But compare the either estimate to the current reported count of less than 3k. It’s likely that the official reports are off by more than an order of magnitude, which is extremely misleading.
Furthermore, as Megan McArdle shows, we need to be extremely careful about looking at recent history to extrapolate the future when we’re dealing with exponential growth.
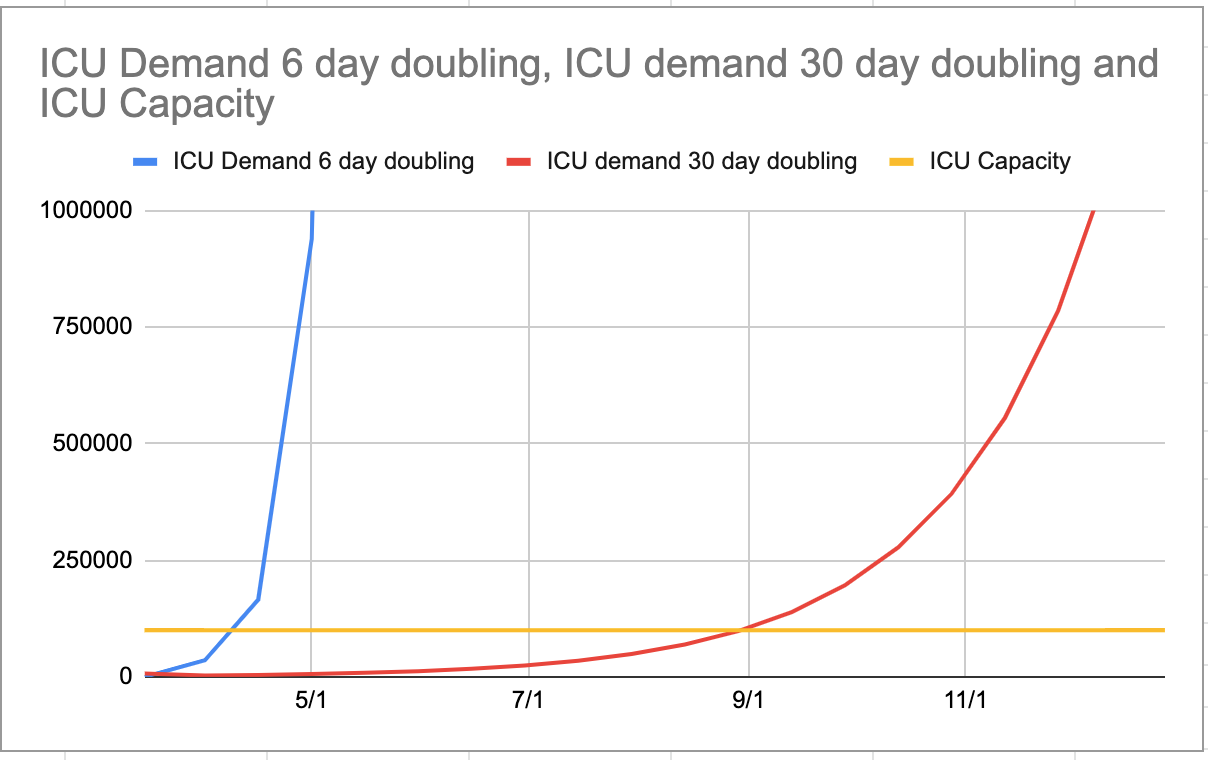
It seems like about 10% of COVID-19 cases need treatment in the ICU. And there are about 100k ICU beds. That means the system can handle roughly a million cases (although other factors like ventilators and personnel matter a lot). I’ll assume a case occupies an ICU bed for ~15 days (this site shows 12 days, but that’s for all hospitalizations, not ICUs).
Assuming there are currently 50k cases (halfway between my estimate of 80k and the 20k estimate above; the exact number doesn’t much matter), and that we continue to double case counts every 6 days, we’ll start to hit our ICU capacity in early May, and drastically exceed it shortly thereafter. Again, this is rough, it may happen before, or after then.
Now, social distancing may increase the doubling time—possibly drastically. I’ve plotted ICU demand below assuming the 6 day scenario continues, and also assuming an immediate change to 30 days (so 5x longer to double). ICU demand is assumed to be 10% of incremental cases over a 15 day period.
If we’re going to “flatten the curve,” it had better happen soon. This is what we’re up against.

Here’s evidence of curve flattening at work. It’s still possible.


And there’s a graphic in this excellent article from the Seattle Times (disable ad blocker for free access and scroll down to chart) which shows some recent models of how contact reduction can bend the curve downward. 25% contact reduction produces 61% reduction in total cases over the next 4 weeks, while a 75% contact reduction produces a whopping 93% reduction in total cases.
From all of this, I believe that immediate and strict social distancing measures in many US cities can still help tremendously. Some measures have been put in place in my city, including closing schools, and large employers encouraging work from home. The state has advised bars and restaurants to close, although they are not yet enforcing that. I don’t know if it will be enough.
The other critical point here is testing: test capacity has been extremely limited for a variety of reasons, but should be coming soon. Testing can no longer help contain the virus, but can help identify infected patients quickly, before they begin showing symptoms, so they can be quarantined.
